ABSTRACT
When the assigned value (Reference Value, RV) of an interlaboratory comparison (ILC) among calibration laboratories is determined as a consensus value from participant results, its uncertainty, U(RV), may be estimated
(i) from the spread of participant results, or
(ii) from participants’ reported uncertainties.
This choice affects
a) the purpose of the ILC (evaluating performance by comparison with (i) the “expected distribution of results”, or (ii) “claimed measurement uncertainty”), and
b) the outcome of the ILC (as choices of U(RV) may differ significantly in magnitude, the fraction of results failing may vary widely depending on this choice).
This article describes methods of estimating U(RV) for RV as mean or median of participant results, applies them to a small hygrometry ILC, and mentions techniques for avoiding bias in a consensus Reference Value.
INTRODUCTION
This article deals with interlaboratory comparisons (ILCs) among calibration laboratories. The method chosen to determine the assigned value (Reference Value, RV) and its uncertainty, U(RV), depends on the precise purpose of the ILC – “to evaluate the performance of participants” by comparison with what, exactly?
According to ISO 13528:2015 (clause 4.3.1), “there are three different general approaches for evaluating performance in a proficiency testing scheme. These approaches are used to meet different purposes for the proficiency testing scheme. The approaches are listed below:
a) performance evaluated by comparison with externally derived criteria;
b) performance evaluated by comparison with other participants;
c) performance evaluated by comparison with claimed measurement uncertainty.”
Deciding on the precise purpose and expressing it clearly, and thereafter choosing RV and U(RV) accordingly, may affect the ILC outcome significantly: the infrared thermometry ILCs, studied in the author’s October 2025 and December 2025 articles, have U(RV) varying by a factor of 4 to 10, depending on whether it is found from the spread of participant results or from participants’ reported uncertainties. As a result, the fraction of discrepant results (|En| > 1) varied from 10% to 20% in the larger (13 participant) ILC.
For calibration laboratories, the participant’s claimed measurement uncertainty, U(LV), is always expected to form part of the performance evaluation. However, U(RV) may be chosen to represent the “expected distribution of results” [ISO 13528:2015 clause 6.4.1], often approximated by the spread of participant results, or to represent the “claimed measurement uncertainties” of one or more laboratories contributing to RV. It will be argued in this article that the spread of participant results is often inappropriate for calibration ILCs, as
(i) the number of participants is usually too small to reliably approximate the “expected distribution of results”,
(ii) the spread of results is often too large to test participants’ Best Measurement Capabilities (CMCs), and
(iii) the metrological traceability of such an assigned value is difficult to determine [ISO 13528:2015 7.7.1.4 d)], as the contributing uncertainties [VIM 3rd ed, 2012] are not used to determine U(RV),
so, U(RV) should rather be formed from the “claimed measurement uncertainties” of one or more laboratories contributing to RV.
DETERMINING THE ASSIGNED VALUE
ISO 13528:2015 sections 7.3-7.7 suggest five ways of determining the Reference Value:
7.3 “Formulation” (“mixing materials with different known levels of a property in specified proportions”) and 7.4 “Certified reference material” are not usually applicable to an ILC between calibration laboratories.
7.5 “Results from one laboratory” (“using a reference method, such as, for example, a primary method”): This approach is often used in calibration ILCs, although the Reference Laboratory usually uses the same calibration method as the participants, just at a smaller uncertainty.
7.6 “Consensus value from expert laboratories” (“using an interlaboratory comparison study with expert laboratories … to characterize a CRM”) seems more intended for the testing field than for calibration.
7.7 “Consensus value from participant results” (possibly “us(ing) a subset of participants determined to be reliable by some pre-defined criteria, such as accreditation status or on the basis of prior performance”) is often used in calibration ILCs.
We will focus on methods 7.5 and 7.7. For 7.5, RV is simply the chosen laboratory’s result, but for 7.7, RV may be the mean, weighted mean or median of participant results, either including or excluding the result of the participant being evaluated. As discussed in previous articles:
(i) the mean is preferred over the weighted mean as “reported uncertainties are … (often) of poor or unknown reliability” [ISO 13528:2015 7.6.3 b)],
(ii) the median is not preferred, though it is more resistant to outliers, as its uncertainty is typically found from the spread of participant results, and
(iii) RV should exclude the result of the participant being evaluated, when there is a small number of participants, as the participant would otherwise be “evaluated against an inappropriate comparison group” [ISO 13528:2015 5.4.1], namely, a group which includes the participant itself. (For a large number of participants, including the participant being evaluated should not bias RV significantly.)
How may a consensus value from participant results be used as RV, when the performance of these same participants is being evaluated by the ILC? The assumptions underlying such a choice are:
(i) The results contributing to RV are (as much as possible) independent – different measurement standards and equipment, different personnel, and (to the extent that generic calibration procedures are implemented differently in different calibration laboratories) different procedures. (Traceability may be to the same NMI, but this is only a significant concern if traceability is a dominant contributor to uncertainty.) The average of such independent results should be more credible than any one individual result. Contributors to RV should ideally be independent from each other (i.e., not from the same laboratory), and independent from the participant being evaluated.
(ii) The laboratories contributing to RV are “reliable” [ISO 13528:2015 7.7.1.1] – if the ILC involves accredited and non-accredited laboratories, the subset of accredited laboratories may be chosen to form RV. Or, certain laboratories may be chosen on the basis of “prior performance” (reputation in the field, or small CMCs, or superior standards and equipment).
DETERMINING THE UNCERTAINTY OF THE ASSIGNED VALUE
According to ISO 13528 clause 7.2.2, the uncertainty of the assigned value, U(RV), is determined as the root-sum-square of:
a) U(char), the uncertainty due to “characterization”: In the case of a calibration ILC, this is found from either the spread of participant results, or the claimed measurement uncertainties of one or more laboratories contributing to RV. (If found from the spread of results, it largely contains components b) to d) below, so they need not be added.)
b) U(hom), the uncertainty due to “differences between PT items”: This component is applicable when multiple samples are drawn from a batch of material, i.e., applicable to testing (not to calibration) ILCs.
c) U(trans), the uncertainty due to “instability caused by transport of PT items”: In calibration ILCs, this is combined with U(stab).
d) U(stab), the uncertainty due to “instability during the period of PT”: This is typically evaluated from opening and closing measurements made by the same laboratory, or by other intermediate checks.
Using method 7.5 (results from one laboratory) to find RV, U(RV) is simply the expanded uncertainty reported by the chosen laboratory, with a component U(stab) added if deemed to be significant.
Using method 7.7 (consensus value from participant results), U(RV) may be found in various ways:
(i) If RV is the mean of participants’ results, U(RV) may be estimated as:
– The spread of those participants’ results: The standard uncertainty is the standard deviation of the mean, stdev/√p, where p is the number of participants contributing to RV. The expanded uncertainty is stdev/√p * t(95%,p-1), where the value of Student’s t-distribution for 95% level of confidence and p-1 degrees of freedom may be found using the spreadsheet function TINV(1-0.95,p-1).
OR
– The combined uncertainty of those participants’ results: U(RV) = √[U1^2 + U2^2 + … + Up^2] / p. (This formula for uncertainty of the mean is similar to the familiar formula for standard deviation of the mean: if U1 = U2 = … = Up = U, then U(RV) = √[p∙U^2] / p = U/√p.) As uncertainties U1, U2 … Up are already expanded to 95% level of confidence, no Student’s t factor need be applied.
(ii) If RV is the median of participants’ results, U(RV) may be estimated as:
– The scaled median absolute deviation, MADe [ISO 13528:2015 C.2.2]:

This “robust standard deviation” of the results, s*, is then used to estimate the standard uncertainty of the assigned value, u(x_pt), as [ISO 13528 7.7.3]:

(Note: The factor 1.25 is based on the standard deviation of the median, or the efficiency of the median as an estimate of the mean [ISO 13528:2015 7.7.3 Note 2]. It is not applicable if the mean is used as RV.)
The expanded uncertainty is then found by multiplying by the value of Student’s t-distribution for 95% level of confidence and p-1 degrees of freedom: U(RV) = 1.25 * 1.483 * med(|LV – RV|) / √p * t(95%,p-1).
EXAMPLE: A SMALL RELATIVE HUMIDITY ILC
In the example below, three laboratories (A, B and Ref) calibrated a hygrometer. There were two participants from lab A, one participant from lab B, and two participants from the Reference Lab. U(RV) is highlighted in yellow.
First, we use RV from the Reference Lab (method 7.5, above):
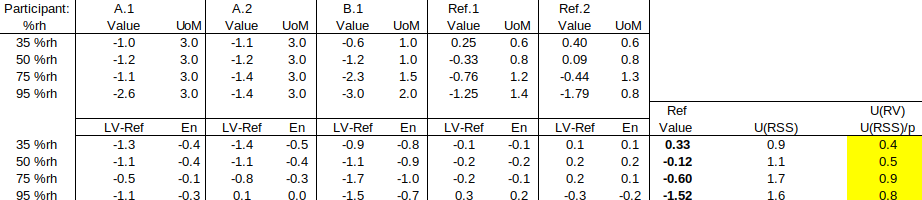
As there were two participants from Ref Lab, RV = mean of Ref.1 and Ref.2, and U(RV) = √[U(Ref.1)^2 + U(Ref.2)^2] / 2. (Note: This method of combining uncertainties assumes the two results are independent – in fact, two results from the same laboratory may be highly correlated, so that U(RV) = [U(Ref.1) + U(Ref.2)] / 2, i.e., assuming full correlation, might have been more appropriate.) Since Ref.1 and Ref.2 form the Reference Value, they achieve very small En values, and their performance should not be evaluated using this RV.
Next, we use the mean of all five participants as RV. (This approach disregards the recommendations (i) to exclude a participant from the RV to which he is compared, and (ii) to use only one result from each laboratory in RV. These will be implemented later in the article.) U(RV) is estimated in two ways: from the spread of participant results, and from the claimed uncertainties of the participants.
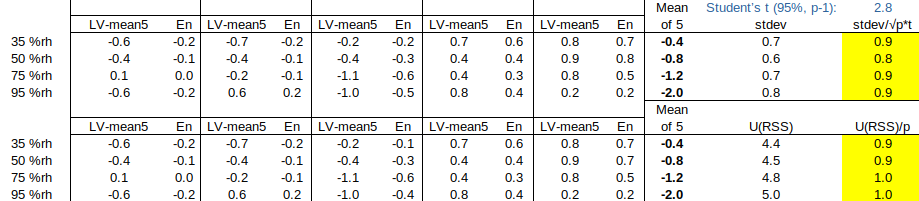
Note that (i) the spread of participant results is coincidentally quite similar to the combined uncertainty, and (ii) even applying Student’s t to compensate for the limited number of participants, the spread of results is still small enough to test participants A.1, A.2 and B.1. However, the concern regarding the traceability of RV, when U(RV) is estimated in this way, remains.
Next, we use the mean of the other two laboratories as RV (the recommended approach): For example, B.1 is compared to RV = AVERAGE(A,Ref), where A = AVERAGE(A.1,A.2), Ref = AVERAGE(Ref.1,Ref.2), U(A) = SQRT{SUMSQ[U(A.1),U(A.2)]} / 2, U(Ref) = SQRT{SUMSQ[U(Ref.1),U(Ref.2)]} / 2 and U(RV) = SQRT{SUMSQ[U(A),U(Ref)]} / 2.
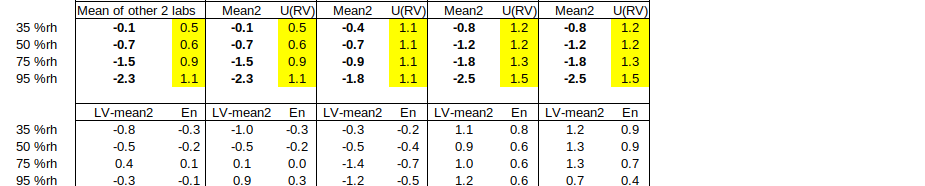
Note that (i) |En| values are generally larger, when the participant’s laboratory’s own result(s) are excluded from the RV to which he is compared, and (ii) lab A, having the largest uncertainties, benefits from the most accurate RV, while Ref Lab cannot test its capabilities as U(RV) to which it is compared is generally too large. This suggests that, when the mean of participant results is to be used as RV, this consequence should be carefully considered during ILC planning. (The weighted mean is far less affected by this issue. However, considering that lab A and lab B probably have similar actual capabilities, but report uncertainties differing by a factor of 1.5 to 3, the reason not to use the weighted mean should be clear.)
Regarding the recommendation to include only one result from each laboratory in RV, consider the graph of participants’ results:
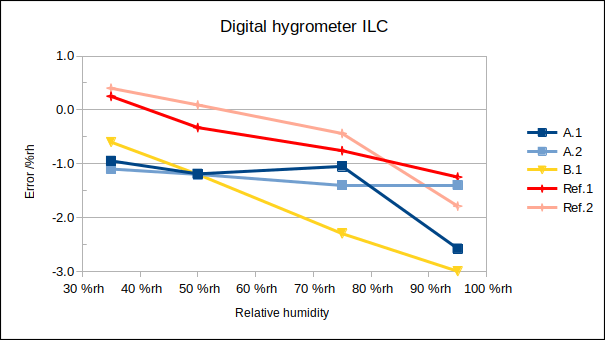
As can be seen, results within a laboratory tend to cluster together (A.1 and A.2 up to 75 %rh, and Ref.1 and Ref.2 at all points). So, particularly in ILCs where laboratories submit widely varying numbers of result sets, it is important to consider this recommendation.
Finally, we use the median of all five participant results as RV, with U(RV) derived from the scaled median absolute deviation (MADe):

Note that, at 50 %rh, three of five |LV-median| values are 0.0 %rh, resulting in U(RV) = 0.0 %rh at that point. This unrealistic outcome is a significant potential shortcoming of this approach in a small ILC.
CONCLUSIONS
∙ Calibration ILCs typically evaluate a participant’s performance by comparison with a Reference Value (RV) from
– one laboratory, or
– a consensus value from participant results (mean, weighted mean or median).
∙ The uncertainty of the Reference Value, U(RV), may be chosen as
– the “claimed measurement uncertainties” of one or more laboratories contributing to RV, or
– the “expected distribution of results” (estimated by the spread of participant results).
∙ If a consensus RV is to be used:
– Choices for U(RV) may differ by an order of magnitude, thereby significantly affecting the ability of the ILC to test participants’ capabilities.
– If U(RV) is determined from the spread of participant results,
(i) the traceability of RV may be unclear, and
(ii) U(RV) may sometimes unrealistically be zero.
– If U(RV) is to be determined from claimed measurement uncertainties, the laboratories contributing to RV should be chosen carefully, considering their CMCs and the expected reliability of their results, so that RV is both accurate and credible.
– The mean (rather than weighted mean) is recommended, as reported uncertainties may vary greatly without technical justification.
– It is recommended to exclude a laboratory’s own result(s) from the RV to which it is compared.
– It is recommended to include only one result from each laboratory in RV, to avoid biasing RV towards the most populous laboratories.
Contact the author at LMC-Solutions.co.za.