When reporting a measurement result, a calibration or testing laboratory may state whether or not it conforms to a certain specification. When reporting whether the result is a “pass” or a “fail”, the laboratory must clearly describe how it accounts for measurement uncertainty in making its decision. (This description of how uncertainty is treated is called a “decision rule”.)
Section 7.8.6 of ISO/IEC 17025:2017 requires the laboratory to “tak(e) into account the level of risk (such as false accept…)”. Guidance on decision rules and the associated risk to the customer may be found in ILAC-G8:09/2019 “Guidelines on Decision Rules and Statements of Conformity” and JCGM 106:2012 “Evaluation of measurement data – The role of measurement uncertainty in conformity assessment”. We will assume that the customer mostly wishes to avoid a “False Accept”, and will therefore calculate the “Probability of False Accept” (PFA) [ILAC-G8 5.2], for which some maximum acceptable value should be agreed between laboratory and customer. We will also determine which statement (“pass”, “fail”, “conditional pass” or “conditional fail”, as per ILAC-G8 4.2.3) to report for a particular guard band. These calculations will be performed using commonly available spreadsheet functions.
We will assume that measured results follow a normal (or Gaussian) distribution, with standard deviation equal to the estimated standard uncertainty, u(k=1). (Note that if the dominant uncertainty component is not normally distributed, the combined uncertainty is unlikely to be [EA-4/02 S8.3], so this assumption will be inappropriate.)
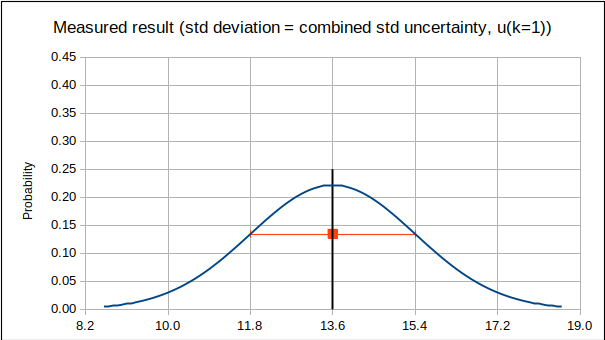
We will use the same numbers as the example in JCGM 106 7.4, so we can check our answers against theirs: result = 13.6, u(k=1) = 1.8, tolerance limits TL = 12.5 and TU = 16.3.
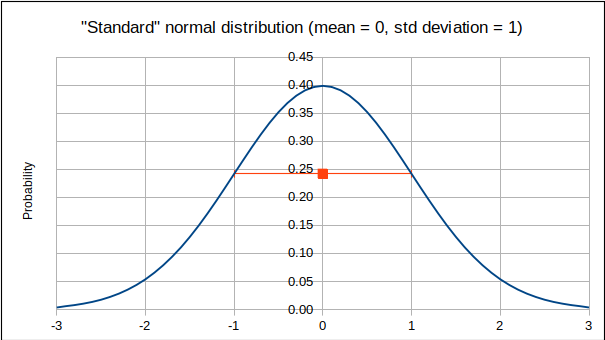
Spreadsheet programs such as Microsoft Excel and LibreOffice Calc include functions that operate on the “standard” normal distribution, which has a mean of 0 and a standard deviation of 1: (The probability density function below is plotted using the spreadsheet function NORM.DIST, with arguments x = -3 to 3, mean = 0, stdev = 1, Cumulate? = 0.)
However, the normal distribution we start with has a mean equal to the measured result, and a standard deviation equal to the combined standard uncertainty, u(k=1):
How do we scale and move our distribution, so it becomes a “standard” one, so that we may use the available spreadsheet functions? (In particular, what do the tolerance limits become, when we transform the distribution?): We subtract the result from the x-values (to centre the distribution around 0), and divide by u(k=1) (to change its “width” to 1): TL’ = (TL – result) / u = -0.61 and TU’ = (TU – result) / u = 1.50.
Now, how do we find the probability that the true value lies within the tolerance limits?: We find the area under the curve of the “standard” normal distribution, between the new tolerance limits, using the function GAUSS, which integrates from 0 to the given value. (The total area under the curve, from -∞ to ∞, is 1.00.): “Probability of True Accept” (PTA) = GAUSS(TU’) – GAUSS(TL’) = GAUSS(1.50) – GAUSS(-0.61) = 0.663 = 66.3%. (As the GAUSS function integrates from 0 to a value, it must be applied twice, to obtain the areas to the right and to the left of the mean value. The subtraction is because the value of the 2nd term is negative, while we need it to be positive.) This probability agrees with that found in JCGM 106 7.4, indicating that we probably performed the calculation correctly.
The “Probability of False Accept” (PFA) is 1.00 – PTA = 1.00 – 0.663 = 0.337 = 33.7%.
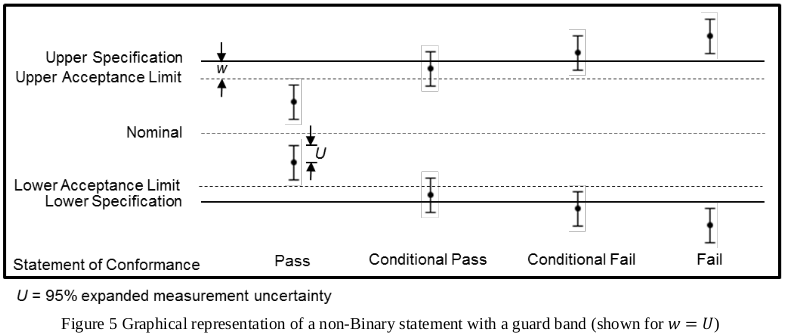
Now, we will implement a “Non-binary Statement with Guard Band”, as per ILAC-G8 4.2.3, using the spreadsheet functions IF, AND and OR to determine whether the statement of conformity should be “Pass” (result within acceptance interval, with guard bands w = rU, where U is the expanded uncertainty and r = 1 leads to PFA < 2.5%), “Fail” (result outside tolerance, with Probability of False Reject < 2.5%) or “Conditional” Pass or Fail (as per Fig 5 in ILAC-G8, reproduced below).
By nesting several IF(test, value_if_TRUE, value_if_FALSE) functions, all four conditions are identified:
IF(OR(result + r*U < TL, result - r*U > TU), “Fail”, IF(AND(result – r*U >= TL, result + r*U <= TU), "Pass", IF(AND(result >= TL, result <= TU), “Conditional pass”, “Conditional fail”))).
Contact the author at LMC-Solutions.co.za.
can you please share one or two examples of decision rule in excel programming
Thank you, This document helps me a lot.