ABSTRACT
This publication follows “Interpolating between discrete calibration points: the effect on uncertainty” of September 2025, describing a more general approach to interpolation of calibration uncertainty (not specific to a particular type of sensor), drawing a tentative conclusion regarding the spacing of calibration points versus resultant uncertainty, and applying this approach to digital thermometer, PRT and thermocouple calibration data.
INTERPOLATING UNCERTAINTY “BY EYE”
Here are two sets of calibration results, reporting correction or error of the Unit Under Test (UUT), and expanded uncertainty, at various temperatures:
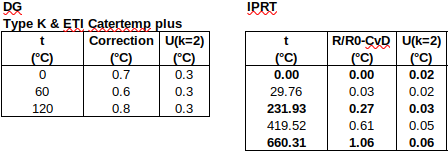
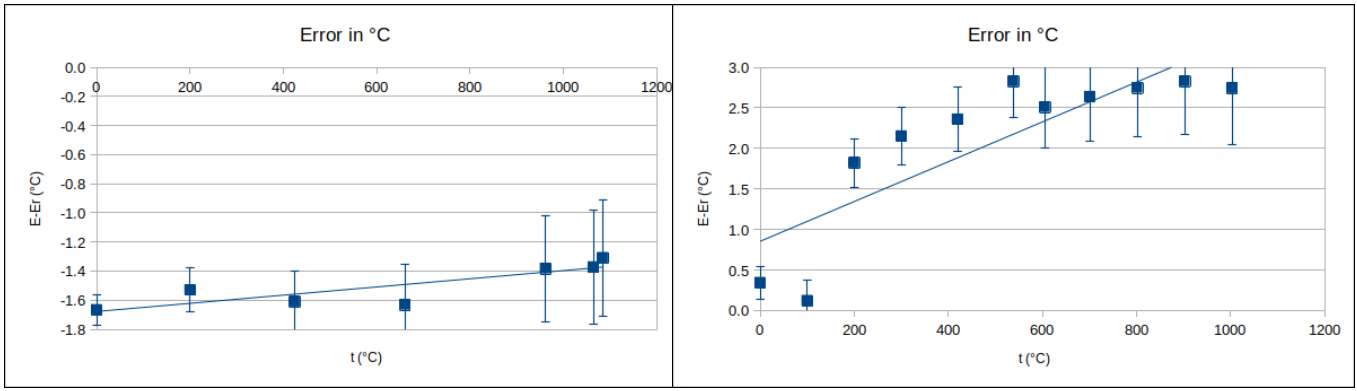
Looking at the left-hand (digital thermometer) results, what do we observe?:
1. The correction at all three temperatures is effectively constant, relative to the calibration uncertainty.
2. The UUT is a thermocouple thermometer with a range of -50 to 300 °C. So, none of the calibration temperatures appears to be “special”. (In this context, “special” temperatures are those where the thermometer might be adjusted to have small corrections, for example, the ends of the operating range, room temperature (where all signal comes from Cold Junction Compensation and none from the sensor), and temperatures where the measuring electronics change range. For a liquid-in-glass thermometer, “special” temperatures would be scale pointing marks.)
These observations lead us to a (tentative) conclusion: The thermometer correction is stable at three “random” temperatures, so the correction at intermediate temperatures can probably be estimated with confidence, without any increase in uncertainty.
Now, looking at the right-hand (IPRT) results, we see:
1. The error varies significantly between calibration points, relative to the uncertainty.
2. The error varies fairly linearly with temperature, though deviation from a straight line is sometimes larger than the calibration uncertainty (at 232 °C, in this case):
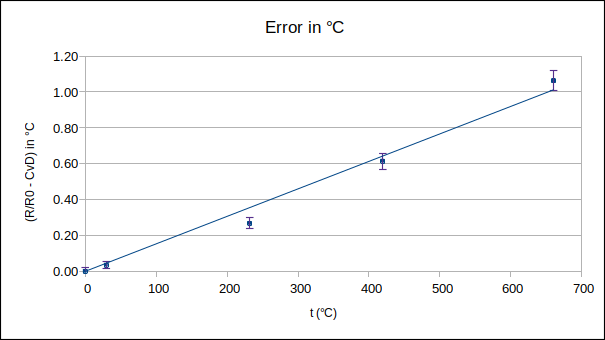
What may we conclude from the IPRT data?: If we wish to estimate the error at an intermediate temperature by linear interpolation, the uncertainty at this intermediate temperature should probably be larger than that at the neighbouring calibration temperatures.
INTERPOLATING UNCERTAINTY – NUMERICAL ESTIMATE
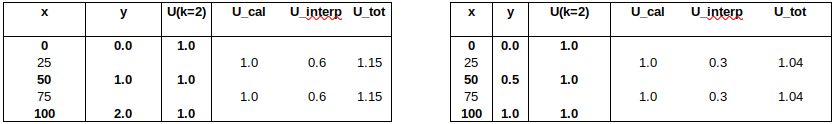
How may we numerically estimate the additional uncertainty caused by interpolation?: If we assume that the value at the interpolated point lies between the two neighbouring calibration values, with an equal probability anywhere in that range, the uncertainty caused by interpolation may be estimated as |corr_1 – corr_2|, as the full-width of a rectangular distribution. (Note: The assumption that the value lies between the two neighbouring calibration values is not necessarily correct for “badly behaved” instruments.) To obtain standard uncertainty, u_interp, divide this by 2√3. Or, for expanded uncertainty, U_interp = u_interp*2 = |corr_1 – corr_2| / √3. Total uncertainty U_tot = √[U_cal^2 + U_interp^2].
This technique is applied for the digital thermometer (using a more recent, larger, data set) and the IPRT mentioned above, with values interpolated between low, middle and high temperatures (in bold) being compared to measured values at intermediate temperatures:
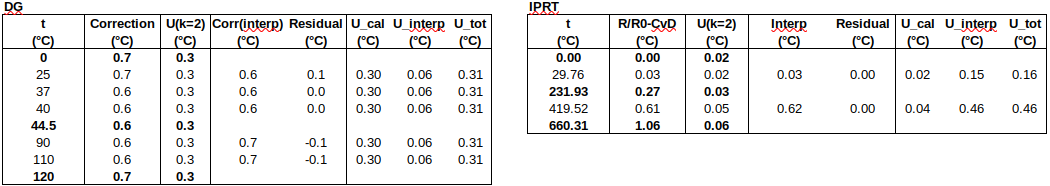
Linear interpolation between the bold calibration results differs from the measured corrections or errors at intermediate temperatures (residual = measured – interpolated) by less than the estimated total uncertainty, suggesting that this approach to interpolating uncertainty is “safe”, at least for these two instruments.
For the digital thermometer, the uncertainty of interpolated values is essentially the same as that of neighbouring calibration points (differs less than 5%), while interpolated values have significantly (~ten times) larger uncertainty for the IPRT. This seems like a reasonable approach, without having any deeper knowledge of the interpolating function (reference function) being used. (The only assumption is that the correction or error varies “more-or-less” monotonically between calibration points.) Note that interpolation may be much more accurate if one does have deeper knowledge of the interpolating function, as reported in the preceding paper, or if one performs a least squares fit to the full set of data.
The digital thermometer results above were stable, and those of the IPRT close to linear. What about non-linear results? The tables and graphs below show results for a type R thermocouple (linear) and a type K thermocouple (non-linear):
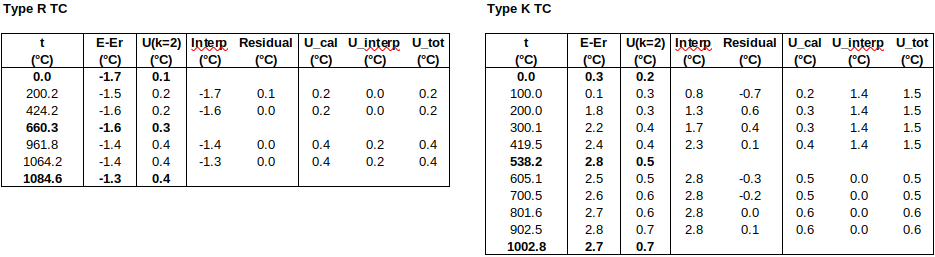
It can be seen that, though the type K’s results are non-linear (and even slightly non-monotonic) at low temperatures, the residual (= measured – interpolated) is always smaller than the total uncertainty.
SPACING BETWEEN CALIBRATION POINTS
If one wishes to add negligible uncertainty from interpolation, how far apart may the calibration points be? Consider the following “generic” calibration results:
If the correction or error, y, changes by at most half the expanded uncertainty, between one calibration point and the next, then the total uncertainty at interpolated points is essentially the same as at the calibration points (differs less than 5%).
CONCLUSION
∙The correction of a UUT at a point intermediate between calibration points may be estimated in a simple manner, by interpolating linearly between the two adjacent calibration values. The uncertainty at this interpolated point may be grossly estimated by adding the difference between the two calibration values in quadrature to the calibration uncertainty. For UUTs with stable corrections, this adds negligibly to the uncertainty, but if the correction varies significantly between calibration points, the resultant uncertainty at the intermediate point is much larger.
∙If the user specifies the calibration points, he takes responsibility for the uncertainty between points [Petersen, “Principles for Calibration Point Selection”, NCSLI Measure, Volume 8, No 3, 2013].
∙If the user only specifies the range, the calibration laboratory should suggest calibration points based on
– instrument manufacturer’s recommendation
– understanding of the operating principles of the instrument
– historical experience with this type or model of instrument (“type testing”)
– in the absence of further information, sufficient points that the UUT correction changes by at most half the expanded uncertainty, between one calibration point and the next (unless some uncertainty is added for interpolation)
– ideally ,the calibration laboratory should be confident enough to include a statement in the certificate such as “Effects due to interpolation are considered negligible over the calibrated range.”
∙The user should agree to the suggested calibration points during contract review.
(Contact the author at LMC-Solutions.co.za.)