The topic of this article is the determination of the resistance ratio, , of a platinum resistance thermometer (PRT) at a thermometric fixed point, such as the freezing point of zinc (
, on the ITS-90 temperature scale). It will discuss the data that should be recorded, the analysis of that data and the estimation of the Uncertainty of Measurement (UoM).
The design of fixed point cells and procedures to realise the required phase transitions are described elsewhere (for example, in Supplementary Information for the ITS-90, also called “the Red Book”). Likewise, using values of at several temperatures
, together with their uncertainties,
, to calculate ITS-90 deviation function coefficients and propagate uncertainty, is covered in papers such as MSL Technical Guide 21 – Using SPRT Calibration Certificates. Here, we only discuss data needed to determine
and to estimate
for one fixed point temperature.
The quantity to be determined is resistance ratio: this is the ratio of the PRT’s resistance at the fixed point temperature ,
, to that at the triple point of water (0.01 °C),
.
Often, more than one PRT will be measured during the melt and freeze plateaus. One PRT must be measured repeatedly, to evaluate certain uncertainty components. We will call this “PRT1″, and the others, “additional PRTs”.
DATA TO BE RECORDED:
1. For each PRT, and
the measurement at the fixed point.
Notes:
a) All three of the resistances, ,
and
, should be measured using the same resistance measuring instrument, on the same range. If it is a bridge, the same standard resistor should be used, too. This is so that two uncertainty components, calibration uncertainty of the standard resistor, and errors in range amplifiers or attenuators, cancel out in the ratio, and only non-linearity of the measuring instrument remains.
b) If a bridge is used with the same standard resistor, bridge ratios may be recorded in place of resistances. Since the standard resistor value, , is constant (except for its temperature variation, considered in the uncertainty analysis, later), using
, or just
, will give the same resistance ratio. This applies for all resistance records mentioned below, except when noted otherwise.
c) Don’t confuse “bridge ratio”, , and “resistance ratio”,
.
2. Furnace or bath setpoints used for melt, supercool, and freeze. This is so that we can change these setpoint temperatures next time, to achieve longer plateaus. Note: Do not make the setpoints so close to the fixed point temperature that stable furnace control may be mistaken for a plateau. Also, ensure that temperature variation does not take the furnace below the melting temperature at certain points during the control cycle (during the melt), or above the freezing temperature (during the freeze). Rather sacrifice some plateau time, and get unambiguous plateaus.
3. Melt:
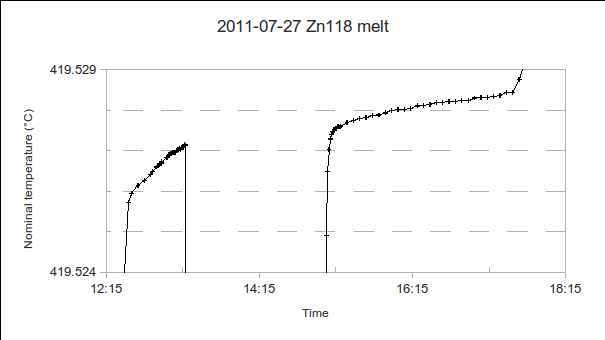
(Note: The y-axes of the graphs below are graduated in temperature units, for convenient visual interpretation. Readings could, equivalently, have been plotted as resistance ratios , resistances
, or bridge ratios.)
a) Start time: This may be determined after completing the measurement, by studying a graph of PRT1’s readings. (In the example above, it’s 12:35.)
b) PRT1’s resistance at the solidus (start of the melt): This is needed to determine the melting range, that is, the difference from the liquidus (at the end of the melt). (In the example above, it’s 419.526 °C.)
c) End time: As for start time. (In the example above, it’s 17:35, in other words, the melt lasted five hours.)
d) PRT1’s resistance at the liquidus (end of the melt): Additional PRTs may be calibrated during the melt (as in the above example, from 13:20 to 15:00), but the end of the melt should be recorded using PRT1, so that the melting range and melt-freeze coincidence can be accurately determined. (In the example above, it’s 419.528 4 °C. In other words, the melting range is 0.002 4 °C.)
4. “Soak”, when the fixed point material is in the liquid state for several hours, after the melt:
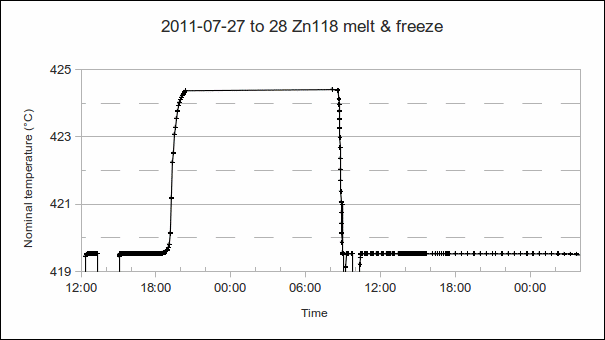
a) PRT1’s resistance, when the temperature has stabilised: Calculate the approximate difference from the melt temperature. (The approximate PRT sensitivity, 0.1 Ω/°C or 0.39 Ω/°C, may be used to convert differences in ohms to °C.) Use this to determine the offset (or error, or correction) of the furnace or bath’s temperature controller. This allows better setpoints to be used next time, more closely approaching the “melt + 5 °C” and “freeze – 1 °C” furnace temperatures commonly desired during melt and freeze. (In the example above, the “soak” temperature is approximately 5 °C above the melt, as desired.)
5. Supercool:
a)Time that the setpoint is reduced: This will tell us how long it takes for recalescence to occur. (If it takes too long, the chosen setpoint may be lower next time.)
b) Setpoint used during the supercool: This is usually several °C lower than that during the freeze, to hasten recalescence and the start of the freeze.
c) Time at which recalescence occurs: See a).
d) PRT1’s resistance, at the moment of recalescence: When the liquid starts solidifying, the temperature starts rising out of the supercool. The depth of the supercool (difference from freeze temperature) gives a rough indication of the “condition” (purity?) of the fixed point cell material. (The more impurities, the more easily nucleation occurs and freezing starts, therefore the shallower the supercool.)
(In the example above, the setpoint was reduced at 8:35, the PRT reached a minimum reading of 419.521 °C, and recalescence occurred at 9:00.)
6. Freeze:
a) Start time.
b) PRT1’s resistance at the liquidus (start of the freeze): If plateau shapes are as expected (PRT reading rising as the melt progresses, and falling as the freeze progresses), the melt-freeze coincidence is calculated as . As the furnace temperature is several °C colder during freeze than melt, this difference in PRT readings indicates the sensitivity (if any) of the PRT to the environment outside the fixed point cell.
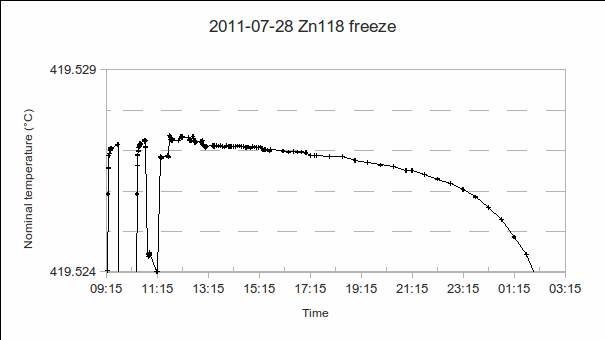
(In the above example, PRT1 reads 419.527 1 °C from 9:25 to 9:45, then an additional PRT is calibrated from 9:45 to 10:20, and PRT1 reads 419.527 2 °C from 10:30 to 10:45. Freeze – melt = 419.527 2 °C – 419.528 4 °C = -0.001 2 °C.)
c) Self-heating of the PRT: If the resistance measuring instrument allows it, change the current passing through the PRT (preferably by a factor of √2 or 1/√2, so that the power dissipated in the resistance element is conveniently doubled or halved) and note the change in its resistance. (These readings are not shown in the graph above.)
d) Vertical temperature gradients in the cell, during the plateau: These should preferably be evaluated during the plateau where the furnace or bath provides least compensation for stem conduction errors, that is, the freeze, for fixed points above room temperature, or the melt, for fixed points below room temperature.
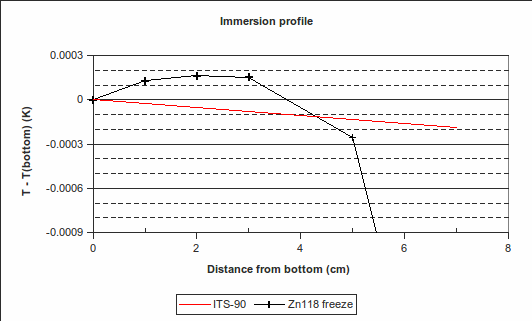
(In the above example, PRT1’s immersion was changed to 70 mm, 50 mm, 30 mm, 20 mm and 10 mm above the bottom of the re-entrant well, from 10:50 to 13:00. Its readings were 419.524 °C, 419.526 8 °C, 419.527 3 °C, 419.527 3 °C and 419.527 2 °C, respectively. Its reading back at maximum immersion was 419.527 1 °C, very close to the value at the start of the freeze, indicating that the zinc cell was still on the freeze plateau. The red “ITS-90″ line in the immersion profile above is the expected variation in freezing temperature caused by a change in depth, according to the hydrostatic head coefficient for zinc published in the ITS-90 Table 2.)
Regarding the sequence of immersion depths: PRT1 is first raised to the highest position, then lowered, step-by-step, back down again. This is because raising the PRT causes some cold air to enter the re-entrant well, temporarily cooling the PRT. To avoid a resulting error, all but one of the measurements are done while increasing the immersion depth.
e) End time.
f) PRT1’s resistance at the solidus (end of the freeze): Additional PRTs may be calibrated during the freeze, but PRT1 should be re-inserted before the end of the freeze, so that the freezing range can be determined. In order to know what time period is available to calibrate other PRTs, record the first melt and freeze (using this combination of fixed point cell and furnace) using just one PRT. Note: If additional PRTs are to be inserted in the fixed point cell, they should be pre-heated (or cooled) to approximately the fixed point temperature, before insertion, to avoid excessive shortening of the freeze plateau.
(As can be seen in the above example, rounding of the plateau makes it difficult to precisely locate the end of the freeze. However, it is the temperature stability during the measurements from 9:25 to 13:00, when additional PRTs, self-heating and immersion measurements were performed, that is most important. The shape of the rest of the plateau is useful as an indicator of furnace temperature uniformity, and, consequently, shape of the solid-liquid interface, as the phase transition progresses, but will not be used in the uncertainty analysis. So, somewhat arbitrarily, the end of the freeze is estimated as 23:15, 419.526 °C, giving a freezing range of about 0.001 °C and a 14-hour freeze plateau.)
DETERMINING THE RESISTANCE RATIO :
The liquidus temperature, when almost all the material is liquid (at the end of the melt or the start of the freeze), is closest to the ideal phase transition temperature [McLaren, “The freezing points of high purity metals as precision temperature standards”, In Temperature: Its Measurement and Control in Science and Industry, Vol. 3, 1962, 185-198]. For all but one of the metal fixed points used to calibrate PRTs (mercury, indium, …, silver), the freeze is usually preferred over the melt. (Gallium is used on the melt, as it has such a large supercool that its freeze cannot be used.) So, for we will use the value at the start of the freeze (the resistance equivalent to 419.527 2 °C), namely, 65.619 14 Ω.
The phase transition temperature published in the ITS-90 is that at the surface of the fixed point material. The temperature changes with increasing depth, due to the increasing pressure exerted by the column of material above the measurement location. For zinc, this hydrostatic head effect is 2.7 mK/m (“depth” coefficient in ITS-90 Table 2). The mid-point of the PRT sensing element is 155 mm below the surface of the zinc, where it is 0.002 7 °C/m x 0.155 m = 0.000 4 °C hotter than at the surface. The resistance corrected for hydrostatic head is therefore 65.619 14 Ω – 0.000 4 °C x 0.1 Ω/°C = 65.619 10 Ω.
For and
, the measured values are 25.547 308 Ω and 25.547 304 Ω, respectively. The hydrostatic head effect in the WTP cell is -0.73 mK/m x 0.265 m = -0.000 19 °C. (Note the difference in sign from zinc: water, unusually, freezes at a lower temperature when the pressure increases.) The resistances corrected for hydrostatic head are 25.547 327 Ω and 25.547 323 Ω, respectively.
The zinc cell was sealed by the manufacturer, with the gas pressure adjusted to be 101.3 kPa at the freezing temperature, so no correction is required for gas pressure. (The phase transition temperature varies with varying gas pressure above the fixed point material, according to the “pressure” coefficient published in ITS-90 Table 2.) The water cell, being a triple point, should not contain any gas but water vapour, so no gas pressure correction is applied here, either.
So, .
The resistances were measured at 1 mA current. (It is common practice to correct fixed point calibration data to 0 mA current, using the self-heating measurements mentioned above. However, here we do not correct for self-heating, as we plan to use the PRT at 1 mA current without applying self-heating corrections. For interest’s sake, the self-heating of this PRT due to the 1 mA current was 0.000 08 Ω at the zinc point and 0.000 02 Ω at the water triple point: these values are very small, owing to the design of this model of PRT.)
COMPONENTS OF MEASUREMENT UNCERTAINTY [CCT-WG3, “Uncertainties in the realisation of the SPRT subranges of the ITS-90″, CCT/08-19/rev]:
1. Gas pressure: The uncertainty in gas pressure inside a sealed fixed point cell may be estimated as 3 kPa (coverage factor k=1), if no method of measuring it exists [CCT-WG3 guide, section 2.1]. To convert to temperature units, use the gas pressure coefficient of for zinc [ITS-90 Table 2], yielding 0.000 1 °C (k=1). For the WTP cell, the residual gas pressure may be estimated by the inverting the cell and observing how much the remaining gas bubble is compressed [CCT-WG3 guide, section 3.1]: observing a reduction in bubble volume of 100 times, we estimate the effect of the residual gas pressure as 0.000 002 °C (k=1).
2. Hydrostatic pressure: We estimate the uncertainty in immersion depth of the mid-point of the PRT element below the surface of the zinc or water to be 10 mm (k=1). (This uncertainty arises from lack of knowledge of the exact depth of the zinc, as well as thermal expansion inside the fixed point cell and the PRT as the temperature rises.) For zinc, 2.7 mK/m x 0.01 m = 0.000 03 °C (k=1). For the WTP, -0.73 mK/m x 0.01 m = 0.000 007 °C (k=1).
3. Chemical impurities and isotopic composition: Earlier, we mentioned that the liquidus temperature is closest to the ideal phase transition temperature, and chose to use the value at the start of the freeze. The liquidus temperature differs from the ideal temperature because the fixed point material is not completely pure. The zinc cell manufacturer reported the total mole fraction of impurities to be . Using this information, the uncertainty in the liquidus temperature may be estimated using the “overall maximum estimate” (OME) method:
, where the cryoscopic constant
for zinc, so that
(k=1) [CCT-WG3 guide, equation (2.23) and Appendix B]. (The melting range following a slow freeze was previously recommended as an indicator of purity: the purer the material, the narrower the melting range. However, some significant impurities may not betray their presence by an increased melting range, so this range is only used for quality assurance purposes now, to indicate changes in the cell or furnace condition.) For the WTP cell, we have no impurity information, so we use a literature value of 0.000 05 °C (k=1.732) [CCT-WG3 guide, section 3.2]. Likewise, for the isotopic composition of the water, we use a literature value of 0.000 1 °C (k=1.732) [CCT-WG3 guide, section 3.3].
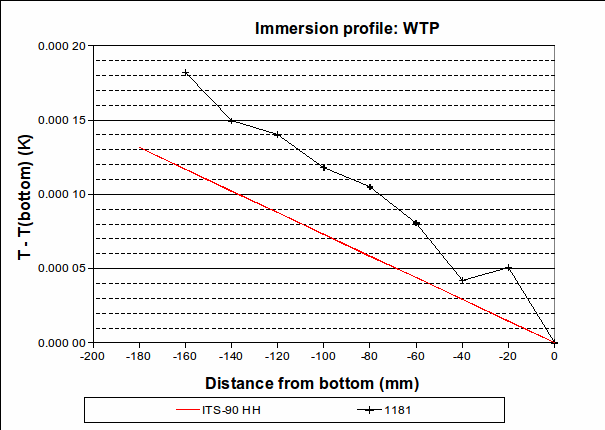
4. Immersion and thermal effects: The vertical temperature gradient measured during the zinc freeze deviates from the expected behaviour by a maximum of 0.000 25 °C over the bottom 30 mm, with the PRT being hotter than expected. (See the difference between the “Zn118 freeze” line and the red “ITS-90″ line in the “Immersion profile” graph above. We choose 30 mm as it is approximately half the length of the PRT element.) However, , suggesting that the lower furnace temperature during the freeze causes the PRT to be colder than expected during that plateau. To be conservative, we will use the larger of these values, 0.001 2 °C (k=1.732), as the uncertainty due to immersion and thermal effects for zinc. For the WTP, the following immersion profile was measured:
The largest deviation from the expected profile, over the bottom 30 mm, is 0.000 036 °C. We use this value as the half-width of a rectangular distribution (k=1.732).
5. Difference from the liquidus point: PRT1 was measured at the end of the melt and at the start of the freeze, that is, at the liquidus point. However, the additional PRTs measured during the melt were 0.001 3 °C to 0.000 8 °C below the liquidus point. (See the melt graph of PRT1, above.) So, the additional PRTs measured during the melt must include an additional uncertainty component of approximately 0.001 °C (k=1.732?) to account for this difference. The one measured during the freeze was at the liquidus point (considering the agreement of PRT1’s readings before and after).
6. PRT oxidation state, crystal defects and strain (variation in ):
changes somewhat during the fixed point measurement, because of various causes. The uncertainty component associated with this variation is
, which is 0.000 02 °C (k=1.732) in temperature units. The effect of variation in
is larger, the higher the temperature: the uncertainty scales according to W(t).
7. Self-heating: We do not correct measured resistances at 1 mA to zero current, therefore we do not include an uncertainty for self-heating.
8. Resistance measuring instrument – non-linearity: The bridge non-linearity has been evaluated as (k=2) in units of bridge ratio. To find the uncertainty in
, multiply by
, which is 100 Ω, yielding 0.000 02 Ω. Dividing by 0.1 Ω/°C, we obtain 0.000 2 °C (k=2).
9. Standard resistor: The temperature coefficient of is
. The maximum variation in its temperature during the measurements is estimated to be 0.2 °C (k=1.732), yielding an uncertainty in
of
, or 0.000 07 °C (k=1.732).
We want to calculate the uncertainty in resistance ratio . To do this, we first calculate
, propagate that to the zinc temperature by multiplying by W(Zn), then combine it with the other components relevant to the zinc point. In doing this, beware of double-counting components: Variation in
must be included in the WTP budget (as is), or in the Zn budget (scaled by W(Zn) = 2.569), but not in both. Bridge non-linearity affects the ratio between Zn and WTP readings more than it does the very narrowly varying
value, so we only count it once, in the Zn budget. Variation in the temperature of the standard resistor was estimated over the day or so between measurements of
and
, so is also only counted once.
WTP uncertainty budget:
| Component | Value (mK) | Divisor | Sensitivity coeff | u(k=1) (mK) |
| Gas pressure | 0.002 | 1 | 1 | 0.002 |
| Hydrostatic head | 0.007 | 1 | 1 | 0.007 |
| Impurities | 0.05 | 1.732 | 1 | 0.029 |
| Isotopic composition | 0.1 | 1.732 | 1 | 0.058 |
| Immersion | 0.036 | 1.732 | 1 | 0.021 |
| Difference from liquidus | ||||
| Variation in Rtp | ||||
| Self-heating | ||||
| Bridge non-linearity | ||||
| Std resistor | ||||
| Propagation of u(Rtp) | ||||
| uc(k=1) | 0.062 |
Zn uncertainty budget:
| Component | Value (mK) | Divisor | Sensitivity coeff | u(k=1) (mK) |
| Gas pressure | 0.1 | 1 | 1 | 0.1 |
| Hydrostatic head | 0.03 | 1 | 1 | 0.03 |
| Impurities | 0.3 | 1 | 1 | 0.3 |
| Isotopic composition | ||||
| Immersion | 1.2 | 1.732 | 1 | 0.7 |
| Difference from liquidus | 0 | 1.732 | 1 | 0 |
| Variation in Rtp | 0.02 | 1.732 | 2.569 | 0.01 |
| Self-heating | ||||
| Bridge non-linearity | 0.2 | 2 | 1 | 0.1 |
| Std resistor | 0.07 | 1.732 | 1 | 0.04 |
| Propagation of u(Rtp) | 0.062 | 1 | 2.569 | 0.16 |
| uc(k=1) | 0.8 |
The dominant component in the Zn budget is immersion (stem conduction error). As we were very conservative in estimating this component (the value from the immersion profile measurement was five times smaller than the freeze-melt value used), we can safely assume large degrees of freedom in this component, therefore large effective degrees of freedom in the combined uncertainty. So, we multiply by a coverage factor of k=2 to obtain the expanded uncertainty . (Actually, as the dominant component follows a rectangular distribution, we’re entitled to use k=1.65 [EA-4/02 M: 1999, Expression of the Uncertainty of Measurement in Calibration, section S9.14], yielding 0.001 3 K, but let’s be conservative and stick with 1.6 mK.)
(Contact the author at lmc-solutions.co.za.)
Have you any comments to make on the following article “The optimization of self-heating corrections in resistance thermometry” Metrologia, 50, page 345-353, (2013) -by J.V. Pearce et al. ? – which basically states that the best method (with 25 ohm SPRT) to extrapolate to zero current is to test at only 2 currents (any more is wasteful) of I(1.0mA) & I/2(0.5mA) and spend 8X the time measuring at the lower current(0.5mA) compared with the higher current(1.0mA).
Your article – 6. Freeze :c) Self-heating of the PRT – uses the commonly accepted method of I & I/1.4142.
Thanks for the valuable comments! Yes, the measurement at the lower current is more significant, as it contributes more to the combined uncertainty. If you report zero-power resistance, R0, the formula is R0 = R1 – (R2 – R1)*i1^2/(i2^2 – i1^2). The sensitivity to uncertainty in R1 is dR0/dR1 = 1 + i1^2/(i2^2 – i1^2). For i2 = 1.41*i1, this yields dR0/dR1 = 2, or, for i2 = 2*i1, dR0/dR1 = 4/3. dR0/dR2 = i1^2/(i2^2 – i1^2), so, dR0/dR2 = 1 for i2 = 1.41*i1 and dR0/dR2 = 1/3 for i2 = 2*i1. In other words, R1 is twice or four times more important, thereby warranting the greater number of repeated measurements.